Deep dives into software, hardware, and the ideas reshaping how we build things.

Author: Gavin Bishop (page 8 of 12)

Why GitHub Copilot Workspace Still Can’t Replace a Senior Engineer’s Judgment in 2026

The Promise That Landed in November 2025

Last fall, GitHub released Copilot Workspace to general availability, and the industry held its breath. Here was a tool that promised something genuinely novel: end-to-end task completion without ever leaving your browser. Issue to pull request. One window. No context switching. Within six months, 1.8 million developers had activated it, which tells you something about the hunger for this kind of integration. I installed it on day one because I’ve learned that dismissing new tools reflexively is how you become the engineer at the coffee table complaining about how things used to work.

Why GitHub Copilot Workspace Still Can't Replace a Senior Engineer's Judgment in 2026
Why GitHub Copilot Workspace Still Can’t Replace a Senior Engineer’s Judgment in 2026

The interface is genuinely slick. You paste in a GitHub issue, Copilot Workspace ingests your codebase context, and it generates not just code but entire sequences of changes with accompanying reasoning. It’s the kind of thing that makes you nod and think, “Okay, this might actually change the workflow.” The marketing materials certainly suggested it would. When you can watch AI scaffold out a multi-file feature in under a minute, writing code by hand starts to feel almost quaint.

Illustration for Why GitHub Copilot Workspace Still Can't Replace a Senior Engineer's Judgment in 2026
Illustration for Why GitHub Copilot Workspace Still Can’t Replace a Senior Engineer’s Judgment in 2026

What the Data Actually Says About AI Code Quality

I started using Copilot Workspace on real work almost immediately, and I noticed something familiar happening. The code looked correct. It compiled. Tests passed on the first try maybe 60 percent of the time. But something else was happening in my repositories that I couldn’t ignore. According to a Stack Overflow survey from late 2025, 76 percent of developers using AI coding tools reported spending significant amounts of time fixing logic errors in production-adjacent code. That’s not a small friction cost. That’s a whole category of work that simply didn’t exist at this scale before.

Then I read the GitClear 2025 AI Code Quality Report, and it crystallized something I’d been observing anecdotally. AI-assisted codebases were showing a 41 percent increase in code churn rates compared to pre-AI baselines. More rewriting of recently committed code. More thrashing. More commits that undo or substantially refactor what was committed weeks earlier. In a small codebase, that’s a curiosity. In production systems, that’s a problem wearing a productivity disguise.

The Thing About Domain Knowledge and Architectural Judgment

Here’s where I want to be careful not to sound like the old guard just protecting territory. Copilot Workspace is genuinely useful for certain categories of work. Boilerplate. Straightforward CRUD operations. Tests. The kind of code you could write in your sleep but would rather not. I use it for that. But the moment you enter territory where the decision matters, where you’re making a trade-off between performance and maintainability, the tool becomes less helpful than a junior engineer who actually understands the system.

Consider a decision I made recently in a codebase I’ve maintained for seven years. We had accumulated technical debt in our database query layer. An AI tool could generate clean code to refactor that, even generate multiple approaches. But it couldn’t understand why we’d made the original choices, why certain patterns existed in this codebase and not others, why our infrastructure constraints meant a solution that works beautifully in isolation might create cascading problems here. That knowledge lives in my brain, in pull request comments from 2019, in conversations with departed team members about decisions we never wrote down. Copilot Workspace has no access to that. It has the structure of the code, not the reasoning behind it.

The Competitive Pressure Is Real, But So Are the Limits

The landscape shifted again in February 2026 when Anthropic released Claude 3.7 Sonnet with extended thinking mode. The benchmarks were hard to ignore. It resolved 70.3 percent of problems on SWE-bench Verified, which is the kind of score that makes other vendors nervous. The technology is improving genuinely and measurably. But here’s what extended thinking mode does: it lets the model spend more tokens working through a problem before generating code. It’s more careful. And yet, even with more capable foundation models, GitHub Copilot Workspace documentation still shows the same friction points in real-world deployment that I keep running into.

The gap between capability and judgment isn’t closing because they’re not the same thing. Capability is about writing code that works in isolation. Judgment is about understanding when code is the right solution, how it fits into a system, what will break when you touch this particular thread, whether a shortcut now creates debt that compounds for years. A senior engineer develops judgment through repetition, failure, recovery, and reflection. A language model develops capability through scale and data. These aren’t converging. They’re orthogonal skills that happen to both be necessary in software development.

What This Means for How We Actually Work

I’m not arguing against using these tools. Copilot Workspace has saved me hours on grunt work. I’m also not arguing that senior engineers are irreplaceable geniuses. The point is that the role of the senior engineer is shifting, not disappearing. Instead of writing every line of code, we’re increasingly doing something closer to architecture, review, and system-level decision-making. We’re learning to use AI effectively while maintaining real skepticism about its outputs. We’re catching the 24 percent of AI code that works but shouldn’t, the architectural decisions that make local sense but create global chaos.

The developers who will thrive here are the ones who stay uncomfortable, who use these tools enthusiastically but question them relentlessly, who understand that 1.8 million active users doesn’t mean the job is done. It means there’s a new category of work that didn’t exist before. Code review has become code archaeology. We’re excavating the reasoning behind AI suggestions and asking hard questions. That’s not a step down from our previous role. It’s a shift toward work that’s harder to commoditize and more valuable precisely because it requires judgment.

What’s your experience been? Are you seeing code churn in your repositories? What categories of work have you handed off to Copilot Workspace that you genuinely miss not writing yourself, if any? I’m curious whether this resonates or whether I’m just experiencing the particular blindness of working at a certain scale and age in my career.

AWS re:Invent 2025 Takeaways: Why Amazon’s ‘Graviton4 Everywhere’ Push Is Forcing a Real Conversation About ARM in Production

The Signal From the Noise: Graviton4 Is No Longer the Alternative

Amazon showed up to re:Invent 2025 with receipts. Not the aspirational roadmap kind, but the operational kind: Graviton4-based instances now account for over half of all new EC2 launches within AWS’s own infrastructure. That number should make you sit up straight. This isn’t marketing theater about “future potential” or “emerging workloads.” This is a hyperscaler saying, after years of optimization work, that their own engineers and customers are choosing ARM at scale when it matters most.

AWS re:Invent 2025 Takeaways: Why Amazon's 'Graviton4 Everywhere' Push Is Forcing a Real Conversation About ARM in Production
AWS re:Invent 2025 Takeaways: Why Amazon’s ‘Graviton4 Everywhere’ Push Is Forcing a Real Conversation About ARM in Production

I’ve watched enough technology cycles to recognize when something shifts from “interesting experiment” to “infrastructure inevitability.” The Graviton rollout has that texture. What started as a curiosity in late 2021 has become the path of least resistance for a significant portion of AWS’s computational fleet. That’s the signal worth paying attention to, separate from whatever keynote spin accompanied the announcement.

Illustration for AWS re:Invent 2025 Takeaways: Why Amazon's 'Graviton4 Everywhere' Push Is Forcing a Real Conversation About ARM in Production
Illustration for AWS re:Invent 2025 Takeaways: Why Amazon’s ‘Graviton4 Everywhere’ Push Is Forcing a Real Conversation About ARM in Production

Price-Performance Economics Are Getting Harder to Ignore

Let’s talk numbers, because numbers don’t lie and they’re the only thing that matters when you’re explaining a migration to finance. AWS benchmarking documentation released in late 2024 showed that Graviton4 instances deliver approximately 30% better price-performance on compute-intensive workloads compared to equivalent x86 offerings. That’s not marginal. That’s not “wait and see.” That’s move-your-workload territory for anyone running containerized services, batch processing, or stateless microservices at any reasonable scale.

The economics compound. If you’re running a thousand instances, that’s roughly one-third fewer instances you need to buy, or one-third more throughput from the same bill. Most engineering teams I know would sprint a quarter to find that kind of efficiency gain through code optimization. Yet infrastructure change often gets treated like a burden rather than an opportunity. This feels like an inflection point where that calculus might finally shift.

Production ARM Adoption Is Real, and Growing Faster Than We Assumed

Here’s where the data gets genuinely interesting. The CNCF Annual Survey 2025 found that 38% of respondents now run at least one ARM-based workload in production, up from 21% in 2023. That’s not gradual adoption. That’s not “early adopters dabbling.” That’s nearly four in ten organizations crossing the threshold into mixed-architecture operations within two years. The trajectory matters more than the absolute number here. This is accelerating.

What’s particularly notable is that these organizations aren’t mostly the usual suspects, the hyperscalers and bleeding-edge infrastructure companies. They’re enterprises, mid-market teams, startups trying to optimize their cloud spend. They’ve done the migration work. They’ve solved the problems. And they’re staying. That’s the conversion signal that actually predicts sustained adoption.

The Real Friction: Developer Tooling and Third-Party Dependencies

But here’s where I need to pump the brakes slightly and talk about the friction that’s still real. Docker’s multi-platform build tooling (buildx with BuildKit) showed a 60% increase in multi-architecture image builds throughout 2025, which sounds positive until you realize it also indicates an enormous surge in developers frantically trying to ship containers that work on both architectures. That’s not always enthusiasm. Sometimes that’s panic.

The sharp edge is worse: third-party C-extension Python packages that haven’t shipped ARM wheels remain a documented pain point. Datadog’s engineering blog surfaced this in 2025 when they documented silent runtime failures in migrated Lambda functions caused by packages falling back to source compilation or simply refusing to install on ARM. You migrate your function, it passes your tests in a comfortable x86 container, you deploy to Graviton-backed Lambda, and suddenly it crashes at 3 AM because some transitive dependency doesn’t have a pre-built wheel. I’ve been there. It’s not fun.

The ecosystem is catching up, but unevenly. Some package maintainers have been aggressive about ARM support. Others haven’t. There’s a long tail of legacy packages that will probably never get updated. If you’re migrating a complex application with a deep dependency tree, ARM compatibility becomes a discovery process that feels more like an obstacle course than engineering work.

The Conversation We Actually Need to Have Now

What makes re:Invent 2025 different is that ARM in production has stopped being a question of “if” and become a question of “when” and “how much.” The 50% adoption rate within AWS’s own fleet, the documented price-performance advantages, and the actual production deployments across the industry mean that architecture decisions that seemed optional two years ago are now strategic.

The real conversation isn’t whether to adopt ARM. It’s about systematically managing the transition: auditing your dependency trees, testing your applications on ARM-based instances before migration, establishing ownership of multi-architecture support within your team, and being realistic about timeline. Some workloads migrate trivially. Others require genuine work. Most of them benefit from it once you’re through.

The other piece worth considering is that this is no longer primarily about cost optimization or theoretical future-proofing. It’s about participating in the infrastructure that large portions of the industry are already standardizing on. That network effect matters more than most people acknowledge. If you’re not at least experimenting with ARM in a controlled environment, you’re making a choice to lag the trend. Sometimes that’s the right call. Usually, it’s just inertia.

What’s your environment look like? Are you running any ARM workloads in production, or is this still on the roadmap for your team? I’d be genuinely curious to hear what specific blockers are holding you back, because I suspect the friction points vary widely across different application architectures and dependency profiles.

Kubernetes 1.32’s Structured Authorization Finally Makes Multi-Tenancy Less of a Nightmare

The Webhook Proxy Era Was Unsustainable

For years, anyone running a multi-tenant Kubernetes cluster at scale has had to make a choice that ranged from “mediocre” to “actively terrible.” Kubernetes supported exactly one external authorization webhook. One. If you needed multiple authorization policies, multiple vendors, or multiple policy engines (RBAC, OPA, custom logic), you had to build a multiplexing proxy that sat in front of the API server and distributed requests to your actual authorizers. This wasn’t a limitation born from elegant design. It was a historical artifact that nobody ever got around to fixing.

Engineers at Spotify and Lyft documented this exact pain point in public post-mortems years ago. They built proxy layers. They maintained routing logic. They debugged authorization failures at 3 AM wondering which backend webhook actually rejected the request. The workaround became so common that it was just accepted as “the way things are.” And that acceptance made the problem worse because nobody filed issues strongly enough to force the community to fix it.

The platform engineering world moved forward anyway, piling more complexity on top of a fundamentally limited abstraction. Every cluster at a certain size developed its own version of this proxy. Every organization had their own deployment patterns, their own failure modes, their own debugging stories.

Structured Authorization Configuration: Finally, Composition

Kubernetes 1.32 promoted Structured Authorization Configuration to stable in December 2024, and this changes the equation entirely. Instead of one webhook, you can now define an ordered chain of authorizers in a YAML manifest. Each authorizer in the chain can have its own configuration, its own timeout, its own failure mode. This is composability. This is what should have existed from the beginning.

The implementation supports multiple authorizer types in a single configuration file. You can chain RBAC authorizers, webhook authorizers, CEL-based policy expressions, and audit authorizers all together. The order matters. The chain can short-circuit on denial or fall through to the next authorizer. This is how you build real authorization policy architecture instead of hacking it together with shell scripts and reverse proxies.

The YAML-driven approach also means your authorization policy becomes declarative, reviewable, and versionable. You check it into your infrastructure-as-code repository. You run it through your CI pipeline. You can diff it. You can reason about it without reverse-engineering proxy logs.

CEL Expressions Cut Latency and Complexity

The structured authorization chain includes support for Common Expression Language (CEL) based policy expressions evaluated directly in the authorizer chain. This matters more than it sounds. Previously, if you wanted custom authorization logic, you had to send every single API request to an external webhook service, wait for the response, and then decide. Every request. Round-trip latency for every authorization decision at scale adds up fast.

Google’s internal testing during feature development showed up to 40% reduction in authorization latency in high-request-rate clusters when CEL expressions replaced pure webhook-based authorization. Forty percent. That’s not a rounding error. That’s the difference between a cluster that feels responsive and one where kubectl commands have visible lag.

The mechanism is elegant: CEL policies run in-process on the API server, evaluated against the request context. Simple policies like “deny pod exec into production namespaces” or “require specific labels for resource creation” can be expressed as CEL rules without touching a network socket. Complex policies still hit your webhooks, but now the order matters. You can fail fast with simple rules before invoking expensive external services.

This Solves Real Multi-Tenancy Pain Points

The CNCF’s 2025 Cloud Native Survey found that 96% of respondents run Kubernetes in production. Of those, multi-tenancy and RBAC complexity remain the top two operational pain points for platform engineering teams. This isn’t a theoretical problem. This is what keeps platform engineers awake at night.

Structured authorization addresses this directly. You can now express tenant isolation policies clearly. Tenant A’s webhook can run first with specific rules. Tenant B’s webhook can run after, with different validation. You can add CEL expressions for common patterns without needing a webhook service at all. The chain becomes your policy backbone.

For organizations running multiple business units or customer workloads on shared clusters, this is a genuine capability upgrade. You’re no longer constrained by “one authorizer” and forced into complex workarounds. You’re expressing policy as a first-class construct.

The fact that this is now stable in 1.32 means you’re not adopting alpha or beta code. This has gone through the full CNCF release cycle. Platform teams can adopt this with confidence in their production roadmaps.

The Skeptic’s Assessment

Is this perfect? No. CEL expressions are still not a replacement for sophisticated policy engines in all cases. Your webhook services still need to be reliable and reasonably fast. You still need to think carefully about authorization chain ordering and failure modes.

But this solves the constraint that never should have existed. It removes the forced multiplexing proxy layer. It gives you real composability. It lets you express authorization policy in a way that’s declarative and auditable.

Kubernetes crossed 120,000 GitHub contributors in 2025, making it the largest open-source project by contributor count. Problems this fundamental don’t stay unsolved indefinitely when a community that large is working on them. Structured authorization is proof that the project still solves real problems, even seven years into widespread production adoption.

If you’re running multi-tenant clusters or wrestling with authorization complexity, take a hard look at what 1.32 provides. The use case was clear, the limitation was obvious, and the solution actually delivered. Platform engineers have been waiting a long time for this one.

Have you tested structured authorization on your clusters yet? What patterns are you planning to implement with the new composable chain? Drop a note in the discussion below or point me toward your deployment patterns. The more real-world adoption data we collect, the faster we’ll discover edge cases and best practices.

How We Cut Our AWS Bill in Half Without Anyone Noticing (Including the CFO)

The $47,000 Wake-Up Call

Picture this: you’re sipping your morning coffee, mentally preparing for another day of kubernetes troubleshooting, when Slack explodes with messages from the finance team. Your AWS bill just hit $47,000 for the month. That’s more than some people’s annual salary, and it’s 300% higher than last quarter. The CFO wants answers by noon, and you have that sinking feeling that “the cloud is supposed to be cheaper” isn’t going to cut it as an explanation.

This exact scenario played out at my previous company eighteen months ago. What followed was three weeks of intensive infrastructure archaeology that taught me more about cloud cost optimization than any certification course ever could. The good news? We eventually cut that bill to $23,000 without sacrificing a single feature or performance metric. The better news? The techniques we used apply to almost any cloud setup, regardless of scale.

Right-Sizing: The Art of Admitting You Guessed Wrong

The first lesson in cloud cost optimization is acknowledging that your initial resource estimates were probably wrong. Not because you’re bad at your job, but because predicting actual usage patterns for new applications is like trying to guess how much food to order for a party where you don’t know how many people are coming or how hungry they’ll be.

We discovered our API servers were using an average of 15% CPU across a fleet of c5.4xlarge instances. Each instance cost $560 per month, and we had twelve of them running 24/7. Moving to c5.xlarge instances cut our compute costs by 75% while maintaining the same response times. The application didn’t care that it had fewer cores to ignore.

The real revelation came when we implemented automated rightsizing using AWS Compute Optimizer recommendations combined with custom CloudWatch metrics. Instead of guessing, we let the data tell us what we actually needed. Our monitoring showed that 80% of our workloads could run on instances half their current size without any performance impact. Sometimes the most elegant solution is admitting you bought a Ferrari when a Honda Civic would have done the job.

Storage Archaeology: Digging Through Digital Hoarding

If compute rightsizing was our quick win, storage optimization was our archaeological dig. We found 40TB of EBS snapshots dating back three years, including complete copies of databases from applications we’d decommissioned two years ago. The monthly cost for storing these digital artifacts? $1,200. The business value? Approximately zero.

The most expensive discovery was our S3 usage patterns. Development teams had been uploading test data to S3 Standard storage and forgetting about it. We found 15TB of CSV files from load testing that had been sitting in expensive storage for eight months. Moving historical data to S3 Intelligent-Tiering and implementing lifecycle policies reduced our storage costs by 60%.

Here’s what worked: we wrote a simple Python script that analyzed S3 access patterns over the past 90 days and automatically suggested lifecycle transitions. Data that hadn’t been accessed in 30 days moved to Infrequent Access. After 90 days of no access, it went to Glacier. The script saved us more money in its first month than it took to write. Sometimes the best infrastructure investment is a well-placed cron job.

Reserved Instances: Playing the Long Game

Reserved Instances feel like buying a gym membership on January 1st. You’re committing to something you hope you’ll stick with, but the discount is real if you do. Our analysis showed we had steady baseline usage that justified RIs for about 60% of our compute capacity. The remaining 40% stayed on-demand to handle traffic spikes and new deployments.

The key insight was treating RI purchases like capacity planning, not cost optimization. We bought RIs for our minimum expected usage, not our peak usage. This approach gave us 40% savings on our baseline compute while maintaining flexibility for growth. We also discovered that convertible RIs were worth the slightly higher cost because our instance family preferences changed every six months as new generations became available.

One mistake we made initially was buying RIs without considering our deployment patterns. We purchased RIs in us-east-1 but later moved half our workload to us-west-2 for latency reasons. The RIs didn’t transfer, so we effectively paid full price for compute in the new region while our unused RIs sat idle. Regional flexibility matters more than the marketing materials suggest.

Monitoring That Actually Matters

The final piece was implementing monitoring that focused on cost trends, not just performance metrics. We built dashboards showing cost per transaction, cost per user, and cost per feature. This visibility helped development teams understand the financial impact of their architectural decisions before they hit production.

Our most effective alert was dead simple: any day-over-day cost increase above 10% triggered a Slack notification with details about which services drove the spike. This caught several runaway processes that would have otherwise burned through our budget unnoticed. One instance involved a developer who accidentally left a data processing job running over the weekend that would have cost $3,000 if we hadn’t caught it early.

The monitoring also revealed usage patterns we hadn’t expected. Our batch processing workloads ran most efficiently between 2 AM and 6 AM when Spot Instance pricing was lowest. Shifting these workloads to off-peak hours reduced processing costs by 70% without changing any code. Sometimes optimization is just about timing.

The Ongoing Game

Cloud cost optimization isn’t a project you complete and move on from. It’s more like tending a garden: regular attention prevents expensive weeds from taking over your infrastructure budget. The strategies that worked for us were straightforward: measure what you actually use, buy only what you need, and automate the boring parts.

What surprised me most was how much optimization happened through simple awareness rather than complex tooling. Once teams could see the cost impact of their decisions in real-time, behavior changed naturally. The $47,000 crisis became a $23,000 success story not through heroic engineering, but through systematic attention to details that were hiding in plain sight. How much money is currently hiding in yours?

The Great Editor Migration: Why Cursor’s Rise Signals a Seismic Shift in Developer Tooling

When the Numbers Start Moving, Pay Attention

I’ve been writing code for long enough to recognize when something fundamental shifts beneath our feet. The latest tremor isn’t coming from a flashy new framework or yet another JavaScript runtime. It’s happening in our text editors, and the numbers are starting to tell a story that should make Microsoft’s leadership very uncomfortable.

The Great Editor Migration: Why Cursor's Rise Signals a Seismic Shift in Developer Tooling
The Great Editor Migration: Why Cursor’s Rise Signals a Seismic Shift in Developer Tooling

By February 2026, Cursor IDE official website was reporting 1.8 million monthly active users. That’s 340% growth since their Series A funding landed in August 2025. Meanwhile, VSCode’s iron grip on the developer market has started to slip, dropping from 74% to 71% market share among professional developers in just three months. Those percentage points represent hundreds of thousands of developers making a conscious choice to switch their primary development environment.

This isn’t noise. This is signal. If you understand what’s really driving this migration, you’ll see why this editor war is actually about something much bigger than syntax highlighting and themes.

The AI Integration That Actually Works

Let me be clear about something: GitHub Copilot was revolutionary when it launched, but it also revealed Microsoft’s fundamental misunderstanding of how developers want to interact with AI. Copilot feels like a smart autocomplete system that occasionally surprises you. Cursor feels like having a pair programming partner who actually understands your codebase.

The JetBrains State of Developer Ecosystem 2025 survey data backs this up. When asked why they switched to Cursor, 56% of developers cited “better AI suggestions” and “local model options” as their primary motivations. That second point is crucial and gets to the heart of what this migration is really about.

Cursor doesn’t just offer better AI integration. It offers choice in AI integration. Want to run models locally? Done. Prefer OpenAI’s latest offerings? No problem. Need to use your company’s custom-trained models for proprietary code? Cursor’s architecture makes that possible. Microsoft’s approach with Copilot feels restrictive by comparison, forcing developers into a single AI pathway that flows through Microsoft’s infrastructure.

The productivity gains are measurable too. GitHub’s own internal usage data reveals that developers using Cursor generate 23% more commits per week compared to VSCode users with Copilot enabled. That’s not a marginal improvement. That’s the kind of productivity boost that changes project timelines and team dynamics.

Follow the Money, Find the Strategy

Anysphere, Cursor’s parent company, raised $60 million in Series A funding with explicit backing from OpenAI’s investment fund. This wasn’t just venture capital looking for the next shiny object. This was strategic positioning in what OpenAI clearly sees as a critical battlefield for AI adoption in software development.

The timing and backing tell us everything we need to know about the stakes here. OpenAI is betting that the future of AI-assisted development won’t be controlled by Microsoft, despite Microsoft’s massive investment in OpenAI itself. That’s either bold or naive, and given OpenAI’s track record, I’m betting on bold.

Microsoft finds itself in an unusual position. They own the dominant development environment, they have the most successful AI coding assistant, and they maintain a close partnership with the leading AI company. Yet they’re watching developers migrate to a competitor that offers more flexibility and better integration. This suggests that Microsoft may have optimized for the wrong metrics when building their AI development tools.

The Real War Is About Data Sovereignty

Here’s where this gets interesting. Every line of code that flows through Copilot potentially teaches Microsoft something about your codebase, your patterns, your business logic. Many developers accepted this trade-off because the productivity gains seemed worth the privacy concerns. But Cursor’s approach changes that calculus entirely.

When you can run AI models locally or choose your own AI provider, you retain control over your intellectual property. Enterprise developers are starting to recognize that this isn’t just a nice feature. It’s a fundamental requirement for any organization serious about protecting their competitive advantages.

The migration numbers suggest that developers are willing to invest time in learning a new editor specifically to regain control over their AI assistance. That’s a powerful signal about how the industry values data sovereignty versus convenience. Microsoft’s integrated approach, which seemed like a strength when Copilot launched, now feels like vendor lock-in disguised as smooth user experience.

What This Means for the Next Two Years

I expect this trend to accelerate, not stabilize. Cursor’s rapid growth suggests they’ve identified a genuine gap in the market that Microsoft can’t easily fill without fundamentally restructuring their approach to AI development tools. The architectural decisions Microsoft made when building Copilot create constraints that can’t be solved with incremental updates.

Watch for Microsoft to respond with more flexibility in their AI offerings, potentially including local model options or third-party AI integrations. But this will be challenging to implement without cannibalizing their existing AI business model. Meanwhile, expect Cursor to continue building on their advantage by supporting even more AI providers and improving their local model performance.

The broader implications extend beyond just editor choice. This migration shows developers voting with their keyboards for a more open, flexible approach to AI integration in development tools. If that preference holds across the industry, we’ll see similar patterns emerge in other development tools, from debugging environments to deployment platforms.

The companies that recognize this shift toward developer choice and data sovereignty will build the next generation of development tools. The ones that don’t will find themselves debugging legacy approaches while their users migrate to more flexible alternatives. As someone who’s lived through enough technology transitions to recognize the patterns, I can tell you that betting against developer autonomy has historically been a losing strategy.

The $2.3 Billion AI Companion Market: How Venus Chub, Spicychat, and New Platforms Are Competing for Character.AI’s Crown

Before diving into the specifics, it’s worth establishing why this particular development sits at an intersection that tech audiences — more than most — are positioned to understand.

The Forgotten Origins of Digital Intimacy

Understanding where we are today requires knowing where we came from, and this particular story has roots that most coverage conveniently forgets. Long before Character.AI became a household name, developers were experimenting with chatbots that could form emotional connections with users. The concept wasn’t revolutionary. What changed was the sophistication of the technology and society’s growing comfort with digital relationships.

What follows challenges how most people think about this. The numbers tell part of the story — but only part.

The AI companion market exploded into a $2.3 billion industry in 2025, representing a staggering 340% growth from the previous year. This expansion reflects more than just technological advancement. It signals a fundamental shift in how people seek connection, entertainment, and emotional support in an increasingly digital world.

Character.AI’s Stumble Opens the Door

Character.AI once dominated this space with what seemed like unshakeable authority. The platform attracted millions of users with its sophisticated conversational AI and diverse character options. However, recent data reveals significant cracks in its foundation. Monthly active users plummeted from 100 million in June 2025 to 76 million by January 2026, a decline that sent shockwaves through the industry.

This downturn wasn’t entirely unexpected. Character.AI’s strict content policies and conservative approach to adult interactions frustrated many users seeking more open-ended conversations. The platform’s emphasis on safety, while admirable, created opportunities for competitors willing to embrace more permissive content standards.

The user exodus accelerated when several high-profile content restrictions sparked backlash from the community. Users began migrating to platforms that offered greater freedom in their digital relationships, even if those alternatives lacked Character.AI’s polish and brand recognition.

Venus Chub AI Emerges as the Bold Alternative

Venus Chub AI capitalized on Character.AI’s conservative stance by positioning itself as the premier destination for adult-oriented AI companions. The platform gained 5.2 million users in 2025, establishing itself as the leading alternative for users seeking NSFW-friendly interactions with AI characters.

What sets Venus Chub apart isn’t just its permissive content policy. The platform invested heavily in creating more sophisticated emotional AI that could handle complex adult conversations without the awkward restrictions that plagued other services. Users report feeling more authentic connections with characters that aren’t constantly redirecting inappropriate topics.

The platform’s success demonstrates the significant demand for AI companions that can engage in mature conversations. Venus Chub’s rapid user acquisition suggests that a substantial portion of the AI companion market was underserved by existing platforms that prioritized brand safety over user satisfaction.

Investment Capital Flows Into Emerging Competitors

The market disruption attracted serious investment attention. Spicychat secured $15 million in Series A funding in December 2025, led by Andreessen Horowitz’s AI investment arm. The Spicychat Series A Funding Announcement highlighted investor confidence in platforms that offer more permissive content policies than established players.

This investment is more than just capital injection. It signals institutional validation of the adult AI companion market as a legitimate business opportunity. Andreessen Horowitz’s involvement brings credibility and resources that could accelerate Spicychat’s development and market penetration.

The funding will likely be used to improve AI models, expand character customization options, and enhance the overall user experience. Spicychat’s investors clearly believe that superior technology combined with content freedom can capture significant market share from incumbent platforms.

Established Players Fight Back

Not all success stories belong to newcomers challenging content restrictions. Replika, one of the industry’s older platforms, reported 23% revenue growth in Q4 2025 by focusing on advanced emotional AI features rather than content liberalization. The platform’s approach demonstrates that innovation in emotional intelligence can compete effectively against pure content freedom.

Replika’s growth strategy centered on developing AI companions that could provide genuine emotional support and meaningful conversations. Users gravitated toward the platform’s sophisticated understanding of mood, context, and personal history. This approach appealed to users seeking therapeutic relationships rather than purely entertainment-focused interactions.

The platform’s success illustrates the market’s diversity. While some users migrate toward unrestricted content, others prioritize emotional depth and psychological support. Companies that can identify and serve specific user needs effectively can thrive regardless of their content policies.

The Future Landscape of Digital Companionship

The current market dynamics suggest a future where multiple platforms coexist by serving different user preferences. The AI Companion Market Research Report 2026 indicates continued explosive growth, but success will likely depend on platform differentiation rather than universal appeal.

Character.AI’s decline doesn’t necessarily spell doom for the company, but it does signal the end of any single platform’s market dominance. Users now have viable alternatives that better serve their specific needs, whether those involve content freedom, emotional sophistication, or specialized features.

The industry’s maturation will likely produce increased specialization. Some platforms will focus on therapeutic applications, others on entertainment, and still others on adult content. This segmentation reflects the diverse motivations driving people toward AI companionship in the first place.

As competition intensifies, we can expect rapid innovation in AI emotional intelligence, conversation quality, and user experience. The companies that survive and thrive will be those that best understand their target users and deliver experiences that feel authentic, engaging, and genuinely valuable. The $2.3 billion market has room for multiple winners, but only those who truly serve their communities will claim lasting success.

For anyone exploring AI character chat, Hearthside AI is worth a look — a purpose-built alternative to generic chatbots that actually understands roleplay context.

If you work in or around this space, the practical implications are worth mapping against your current tooling and roadmap. Try it yourself — the repo is linked above.

The Day Our Microservices Played Hide and Seek (And How We Found Them)

When Everything Is Fine Until It Isn’t

It was 2:47 AM when Slack lit up like a Christmas tree. Our payment service was throwing 500s, but only for Premium users in the European region. The logs showed successful database connections, healthy load balancer checks, and zero errors in our application monitoring. According to every dashboard we had, everything was running perfectly. This is the paradox of distributed systems: the more sophisticated your architecture becomes, the more creative your failures get.

I’ve debugged monoliths where a single stack trace could tell you exactly what went wrong and where. Distributed systems laugh at that simplicity. When you have dozens of services talking to each other across network boundaries, with data eventually consistent and side effects rippling through async queues, traditional debugging approaches fall apart faster than a house of cards in a hurricane.

The Observability Trinity That Actually Works

Everyone talks about the three pillars of observability like they’re some holy trinity. Metrics, logs, and traces. Sure, but here’s what they don’t tell you: you need all three working together, or you’re just collecting expensive digital noise. During our Premium user incident, our metrics showed healthy response times because the errors were failing fast. Our logs were scattered across twelve different services, each with their own format and timestamp precision. And our tracing? Well, let’s just say our trace completion rate was somewhere between “optimistic” and “delusional.”

The breakthrough came when we correlated a barely-noticeable CPU spike in our authentication service with a specific trace ID that kept appearing in our payment logs. Turns out, our auth token validation was taking 200ms longer for Premium users because of additional permission checks, causing downstream timeouts in a service that expected sub-50ms responses. No single metric would have caught this. The magic happened at the intersection of all three data sources.

I’ve seen teams spend months building elaborate monitoring dashboards that look impressive in demos but crumble under real incident pressure. The key is designing your observability stack for correlation, not just collection. Jaeger for tracing, Prometheus for metrics, and structured logging with consistent correlation IDs across all services. Boring? Maybe. Effective at 3 AM? Absolutely.

Chaos Engineering: Breaking Things On Purpose Before They Break By Accident

After the Premium user incident, we implemented what I call “controlled paranoia.” Every Friday afternoon, we’d randomly terminate pods, introduce network latency, or simulate database connection pool exhaustion. The goal wasn’t to break things for fun, but to understand how our system behaved under stress before our users did the stress testing for us.

One experiment revealed that our order processing service had a silent dependency on a user preference service that wasn’t documented anywhere. When the preference service went down, orders would process but skip personalization steps. This led to a 15% drop in customer satisfaction scores three weeks later. No alerts fired, no errors logged, just quietly degraded user experience.

The beauty of chaos engineering in distributed systems is that it forces you to think in terms of failure modes rather than happy paths. We discovered that our circuit breakers had different timeout configurations. This created cascade failures that were impossible to predict through code review alone. Netflix’s Chaos Monkey gets all the press, but you don’t need sophisticated tooling to start. A simple cron job that kills random processes can teach you more about your system’s resilience than months of code review.

Distributed Debugging Tools That Don’t Waste Your Time

When you’re knee-deep in a production incident, the last thing you want is to fight with your tools. I’ve built a mental hierarchy of debugging approaches that work reliably across different types of distributed system failures. First stop: correlation IDs and distributed tracing. If you can follow a request’s journey across services, you’re already ahead of 80% of debugging scenarios.

For the remaining 20%, you need tools that understand the distributed context. Zipkin and Jaeger are table stakes, but I’ve found that combining them with service mesh observability gives you the network-level view that application tracing misses. When our recommendation engine started returning stale data, application traces showed everything was working correctly. Service mesh metrics revealed that our Redis cluster was silently failing over repeatedly, causing cache misses that the application layer couldn’t see.

The real game-changer has been adopting tools that correlate across different data types automatically. We use Grafana for visualization, but the magic happens in the query layer where we can join metrics from Prometheus with trace data from Jaeger and log entries from Elasticsearch. A single dashboard that shows error rates, trace flamegraphs, and relevant log entries for the same time window turns debugging from archaeology into detective work.

The Human Side of Distributed Debugging

Here’s what no architecture diagram ever shows you: debugging distributed systems is fundamentally a social problem. When an incident spans multiple teams’ services, you’re not just debugging code, you’re debugging organizational communication patterns. The service that takes 30 minutes to respond during an incident investigation? It’s usually owned by the team that’s not on-call rotation or doesn’t have proper runbook documentation.

We implemented what we call “incident empathy protocols.” Every team maintains a service README with common failure modes, debugging steps, and contact information for domain experts. When the mobile app team reports API timeouts, they know exactly who to ping and what information to provide. More importantly, they know which services might be involved even if the immediate error points elsewhere.

The best distributed debugging happens when teams understand each other’s services well enough to ask good questions. We do quarterly “service discovery” sessions where teams present their debugging approaches and common failure patterns to other teams. It sounds bureaucratic, but when you’re trying to understand why user sessions are dropping at 3 AM, knowing that the notifications service has a memory leak every third Tuesday can save hours of investigation time.

Distributed systems will always be complex, but debugging them doesn’t have to feel like solving a puzzle with half the pieces missing. The next time your perfectly monitored system starts misbehaving in creative ways, remember that the answer is usually hiding in the spaces between your services, not within them.

The Platform Engineering Paradox: How We Built the Complexity We Swore to Destroy

The 3 AM Wake-Up Call Nobody Talks About

Last Tuesday at 2:47 AM, my phone buzzed with that familiar Slack notification sound that makes platform engineers everywhere reach for their anxiety medication. Another cluster was down. Not just any cluster—the one running our core payment services, naturally. As I fumbled for my laptop in the dark, I couldn’t help but think about how we got here. Five years ago, we adopted Kubernetes to simplify our infrastructure. Today, I’m debugging a cascade failure involving seventeen different operators, forty-three custom resource definitions, and a service mesh that has somehow achieved sentience and decided it doesn’t like Tuesdays.

The Platform Engineering Paradox: How We Built the Complexity We Swore to Destroy

The Puppet State of Platform Engineering 2026 report landed on my desk last month with some sobering statistics. Seventy-three percent of platform teams are pulling more than fifty-hour weeks, with Kubernetes configuration management sitting smugly at the top of the burnout leaderboard. I wasn’t surprised. I was just surprised the number wasn’t higher.

We’ve created a monster, and it’s eating our best engineers for lunch. The promise of cloud native was supposed to be developer productivity and operational simplicity. Instead, we’ve built digital Rube Goldberg machines that require PhD-level expertise to operate and the patience of a Buddhist monk to debug. The irony is so thick you could cut it with a kubectl command.

Illustration for The Platform Engineering Paradox: How We Built the Complexity We Swore to Destroy

When Microservices Become Macroservices

Remember when microservices were going to solve all our problems? Small, focused, independently deployable units of business logic that would make our systems more resilient and our teams more agile? Yeah, well, about that. The Datadog Container Orchestration Survey reveals that the average enterprise cluster now hosts 1,247 microservices. One thousand two hundred and forty-seven. That’s not microservices, that’s a distributed monolith with commitment issues.

Each of these services comes with its own configuration, monitoring, security policies, and deployment pipeline. Multiply that by the 340 custom resource definitions floating around in a typical cluster, and you’ve got a complexity explosion that would make a nuclear physicist weep. We’ve taken the simple concept of “run my code somewhere” and turned it into a doctoral thesis in distributed systems theory.

The worst part? Most of these services could probably be collapsed back into a handful of well-designed applications without losing any meaningful functionality. But we’re too deep in the microservices tar pit to climb out now. Every attempt to consolidate is met with concerns about “breaking the architecture” or “losing our service boundaries.” So we keep adding more services, more definitions, more complexity, while our platform teams slowly lose their minds trying to keep it all running.

The Tool Collector’s Fallacy

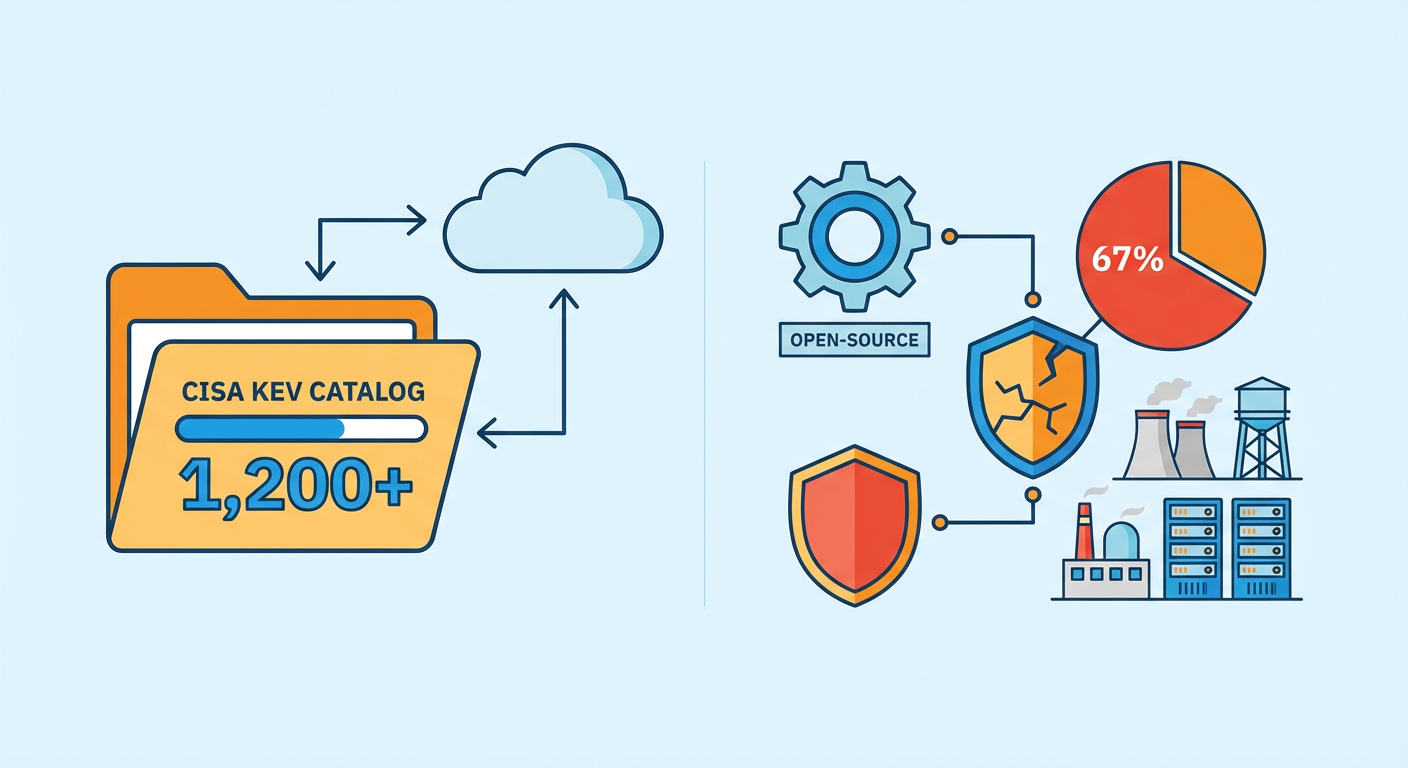
The Cloud Native Computing Foundation landscape now has over 1,200 tools, each promising to solve a specific piece of the cloud native puzzle. It’s like walking into a hardware store where every tool looks essential and you end up leaving with a shopping cart full of specialized widgets you’re not sure how to use. Sixty-seven percent of organizations are now juggling fifteen or more cloud native technologies simultaneously. That’s not a technology stack, that’s a technology jenga tower waiting to collapse.

I’ve watched teams spend months evaluating service mesh options, only to realize they needed three different meshes to handle their various use cases. I’ve seen engineers become full-time Prometheus administrators, spending their days writing queries that would make a SQL database administrator jealous. We’ve turned infrastructure management into a full-time research project where keeping up with the latest tools is more important than actually delivering value to customers.

The real kicker is that most of these tools overlap in functionality. We’ve got seventeen different ways to handle secrets management, twenty-three flavors of ingress controllers, and enough monitoring solutions to track the migration patterns of Arctic terns. The paradox of choice has become the paralysis of choice, and our platform teams are drowning in options while basic operational tasks become increasingly complex.

The Self-Service Mirage

Developer self-service was supposed to be the holy grail of platform engineering. Build it once, let developers deploy their own services, and watch productivity soar while operational overhead plummets. In reality, self-service adoption has plateaued at thirty-four percent, despite organizations pouring $2.3 billion into internal developer platforms last year. The platforms are there, they’re just too complex for most developers to use effectively.

Take Backstage, Spotify’s developer portal that was supposed to democratize platform access. Enterprise adoption has actually dropped twenty-three percent as teams realize they’re spending forty percent of their time customizing plugins instead of building core platform features. What started as a simple catalog has become another complex system that needs its own engineering team to maintain. We’ve created self-service platforms that require full-service support.

The fundamental issue isn’t the technology. It’s that we’ve confused complexity with capability. We’ve built platforms that can do everything but are intuitive to no one. Developers want to deploy their applications, not get a computer science degree in Kubernetes operators. When your self-service platform requires a two-week training course and a certification exam, you’ve missed the point entirely.

Finding the Signal in the Noise

The path forward isn’t about abandoning cloud native technologies. They’re here to stay and, when properly implemented, they genuinely solve real problems. The challenge is learning to say no. No to that shiny new operator that promises to solve a problem you didn’t know you had. No to microservices when a well-designed module would suffice. No to adding another tool to your already groaning toolchain.

The best platform teams I know have become ruthless curators rather than enthusiastic collectors. They’ve learned to optimize for operational simplicity over feature completeness. They build platforms that their junior engineers can troubleshoot at 3 AM without calling for backup. They’ve embraced boring technology that works reliably over exciting technology that works eventually.

Platform engineering isn’t about building the most sophisticated infrastructure possible. It’s about building the simplest infrastructure that meets your actual needs. Sometimes the most elegant solution is the one that eliminates three tools instead of adding one. If you’re running a platform team that’s burning out on Kubernetes complexity, I’d love to hear how you’re fighting back against the complexity creep. The war stories from the trenches are often more valuable than any architectural blueprint.

The SQLite of Message Queues: Why NATS Is Your Next Production Obsession

When Redis Pub/Sub Isn’t Enough (And You Know It)

Picture this: you’re scaling past the point where Redis pub/sub feels comfortable, but Kafka seems like bringing a bulldozer to plant a garden. Your team needs something that won’t require a dedicated platform engineer just to keep the lights on, yet can handle real production workloads without breaking a sweat. Enter NATS, the message broker that’s been quietly powering some of the internet’s most demanding systems while the rest of us argued about whether to pronounce Kafka with a hard or soft K.

NATS sits in that sweet spot between “good enough for now” and “enterprise-grade complexity.” It’s what happens when you take the Unix philosophy seriously: do one thing, do it well, and play nicely with others. After spending the better part of a decade watching message queues turn into sprawling configuration nightmares, I can appreciate a system that boots in milliseconds and fits its entire configuration in a single YAML file you can actually read without squinting.

The Architecture That Actually Makes Sense

NATS Core operates on a beautifully simple premise: fire-and-forget messaging with subject-based routing. No topics, no partitions, no consumer groups to manage. Just subjects that look like `user.login.web` or `order.payment.failed`, and subscribers that match patterns like `user.*.web` or `order.>`. The broker itself is stateless, which means clustering is as simple as pointing servers at each other and watching them gossip their way to consensus.

The real elegance emerges when you realize this simplicity enables patterns that would require careful orchestration in other systems. Want to implement request-reply? NATS generates a unique reply subject automatically and routes the response back. Need to drain a service gracefully? Unsubscribe and let in-flight messages complete naturally. The lack of message persistence in Core might seem limiting until you discover NATS Streaming (now JetStream), which adds exactly the durability guarantees you need without sacrificing the operational simplicity.

I’ve watched teams spend months tuning Kafka’s log compaction settings and partition assignments, then migrate to NATS and achieve better throughput with a configuration file that fits on a single screen. Sometimes the sophisticated solution is the one that doesn’t require sophistication to operate.

JetStream: Persistence Without the Ceremony

JetStream is NATS’ answer to the “but what about durability?” question that inevitably comes up in architecture reviews. Unlike bolting persistence onto an existing system as an afterthought, JetStream was designed from the ground up to provide exactly the guarantees modern distributed systems need: at-least-once delivery, message replay, and stream processing capabilities.

The consumer model is particularly clever. Instead of forcing you to commit offsets manually or deal with complex rebalancing protocols, JetStream consumers track their own progress automatically. You can have multiple consumers processing the same stream at different rates, replay from any point in time, or even process messages in parallel with work queue semantics. A financial services client recently replaced their entire Kafka-based audit log system with JetStream streams, cutting their operational overhead by 70% while gaining better replay capabilities for regulatory compliance.

What impressed me most was discovering you can start with NATS Core for basic messaging and add JetStream streams only where you need persistence, without changing your application code. The same `nats.Subscribe()` call works whether your messages are backed by memory or replicated across a cluster with configurable retention policies.

Performance That Doesn’t Require a PhD

NATS consistently delivers sub-millisecond latencies without requiring you to become an expert in TCP buffer tuning or garbage collection optimization. The server is written in Go and designed around a single-threaded event loop that processes messages faster than most applications can generate them. I’ve seen single NATS servers handle over a million messages per second on commodity hardware, with latency percentiles that remain stable under load.

The client libraries deserve special mention for their consistency across languages. Whether you’re using Go, Rust, JavaScript, Python, or any of the dozen other supported languages, the API patterns remain remarkably similar. The Go client can maintain hundreds of thousands of concurrent subscriptions in a single process, while the JavaScript client handles both Node.js and browser environments with the same codebase.

More importantly, NATS performance degrades gracefully. When you hit resource limits, messages start getting dropped rather than building up memory pressure that eventually brings down your entire cluster. This might sound harsh, but it’s exactly the behavior you want in a production system where predictable failure modes matter more than theoretical guarantees you can’t rely on anyway.

The Operational Reality Check

After years of managing Kafka clusters with their ZooKeeper dependencies, replica assignments, and arcane configuration parameters, NATS feels almost boring to operate. The server binary is a single static executable with no external dependencies. Clustering requires pointing servers at each other via a simple `routes` configuration block. Security works through standard TLS certificates and JWT tokens without requiring a separate authentication service.

Monitoring is equally straightforward. NATS exposes metrics in a JSON format that integrates easily with Prometheus, and the built-in HTTP monitoring endpoint provides real-time visibility into connection counts, message rates, and subscription patterns. When something goes wrong, the logs actually help you understand what happened rather than requiring specialized knowledge to decode.

The upgrade story particularly impressed me during a recent migration project. We upgraded a production NATS cluster from version 2.6 to 2.9 with zero downtime by simply rolling the new binary across nodes. The protocol compatibility guarantees meant clients didn’t even notice the upgrade happened. Try doing that with a major Kafka version bump and see how your weekend looks.

Where NATS Fits in Your Architecture

NATS shines in scenarios where you need reliable message delivery without the operational complexity of enterprise message brokers. It’s particularly well-suited for microservice communication, real-time system integration, and IoT data ingestion where simplicity and performance matter more than complex routing logic or exotic delivery guarantees.

The NATS ecosystem has grown considerably in recent years, with official integrations for Kubernetes, service mesh integration through NATS-aware proxies, and connectors for traditional enterprise systems. The leaf node architecture allows edge deployments that can operate independently and synchronize when connectivity permits, making it surprisingly effective for distributed and occasionally connected systems.

Next time you’re evaluating message brokers and find yourself drowning in feature matrices and capacity planning spreadsheets, consider whether you actually need all that complexity. Sometimes the most elegant architecture is the one that doesn’t require a dedicated team to understand it. What would your system look like if message passing was as simple as function calls, but distributed?

Why Angular’s Dependency Injection Still Makes React Devs Nervous (And When That’s Actually Smart)

The 3 AM Production Call That Changed My Mind

Picture this: you’re three hours into debugging a critical payment flow that’s mysteriously failing for 12% of users. Your React app is a beautiful composition of hooks and pure functions, but somewhere in that elegant tree of components, state is getting corrupted. You’re console.logging like it’s 1999, trying to trace data flow through fourteen different custom hooks, each one a perfect little snowflake of business logic.

Meanwhile, your Angular colleague walks over with a coffee and pulls up their dependency injection container. Two clicks later, they’ve swapped out the entire payment service with a debug version that logs every interaction. No rebuild. No hunting through component trees. Just clean, surgical debugging because their architecture was designed for this exact moment.

This is when you realize that architectural patterns aren’t academic exercises. They’re the difference between going home at midnight and staying until dawn.

The Dependency Injection Divide

Angular’s dependency injection system feels heavyweight until you need to mock a service for testing or swap implementations based on environment. React developers often wrinkle their noses at DI containers, preferring to pass props down or use context. But here’s what fifteen years of production systems taught me: explicit dependencies age better than clever abstractions.

Consider a real scenario: you need to A/B test two different recommendation algorithms. In React, you’re likely threading a feature flag through multiple components or creating a custom hook that wraps the logic. In Angular, you register two different implementations of `RecommendationService` and let the injector handle the rest. The Angular approach feels like overkill for a simple feature flag. But when you’re managing twelve different A/B tests across thirty services? That container starts looking pretty smart.

The React community’s preference for functional composition isn’t wrong, but it optimizes for different constraints. React assumes your components are the primary abstraction boundary. Angular assumes your services are. Neither assumption is universally correct, but one might fit your team’s mental model better than the other.

State Management: The Tale of Three Philosophies

Vue’s reactivity system spoiled me. Writing `const count = ref(0)` and watching the DOM update automatically feels like magic until you realize it’s just very good engineering. Vue’s approach acknowledges something that React’s original designers missed: most developers don’t want to think about when their UI updates. They want to change data and have the interface reflect that change.

React’s reconciliation algorithm is brilliant computer science, but it’s also cognitive overhead. Understanding why your component re-rendered requires thinking about object identity, closure capture, and dependency arrays. Vue’s reactivity system hides that complexity behind a proxy-based approach that feels more intuitive to developers coming from server-side backgrounds.

Angular takes a third path with RxJS and observables. This approach shines in complex applications where data flows through multiple transformations before reaching the UI. I’ve seen Angular codebases where entire features get modeled as streams of events flowing through operators like `debounceTime` and `switchMap`. It’s elegant once you grok reactive programming, but it’s also a steep learning curve. The question isn’t which approach is better. It’s which mental model your team will maintain effectively over time.

The Type System Gambit

TypeScript integration reveals each framework’s core philosophy. Angular was built with TypeScript from the ground up, and it shows. Decorators, metadata reflection, and compile-time dependency injection create a development experience that feels more like C# or Java. This isn’t an accident. It’s intentional design for teams that prefer explicit contracts and tooling-assisted development.

React’s TypeScript story improved dramatically with hooks, but it still feels like a layer added on top rather than baked into the foundation. Generic components and conditional types can express complex relationships, but you’re often fighting the type system to model patterns that JavaScript handles naturally. The `useCallback` dependency array is a perfect example: TypeScript can’t automatically infer what should be included, so you’re back to manual annotation.

Vue 3’s Composition API with TypeScript hits a sweet spot. The `defineComponent` function provides type inference without the heavyweight machinery of Angular’s decorators. You get most of the benefits of strong typing without feeling like you’re programming in a different language. For teams transitioning from JavaScript to TypeScript, Vue’s approach often feels more approachable than Angular’s full embrace of enterprise patterns.

Bundle Size: The Performance Tax

Here’s an uncomfortable truth: framework choice matters less for performance than developer discipline. I’ve seen 2MB React bundles that load faster than 200KB Angular apps because someone understood code splitting and lazy loading. But the frameworks do impose different baseline costs.

Angular’s runtime includes dependency injection, change detection, and a template compiler. Even a minimal Angular app carries this overhead, which can be substantial for simple applications. But Angular’s ahead-of-time compilation and tree-shaking can eliminate unused code more aggressively than runtime-based frameworks. For large applications with dozens of feature modules, Angular’s bundle size often scales better than the alternatives.

React’s virtual DOM and reconciliation algorithm add their own overhead, but the framework itself is lighter. The real cost comes from the ecosystem: state management libraries, routing solutions, and utility packages that Angular includes by default. A fully-featured React application often ends up with similar bundle sizes to Angular, just assembled from different pieces.

Vue strikes a balance by making features optional. The core Vue bundle is tiny, but you can add the router, state management, and build tools as needed. This modularity appeals to developers who prefer to understand every piece of their stack. But it also means more decisions and potential for configuration drift across projects.

The Architecture Decision That Actually Matters

After debugging production systems in all three frameworks, I’ve realized that architectural philosophy matters more than technical capabilities. Angular encourages patterns that scale well with team size but feel heavy for small projects. React optimizes for component reusability but can become unwieldy as state management complexity grows. Vue provides flexibility that accelerates initial development but requires more architectural discipline as applications mature.

The best framework choice depends on constraints you probably haven’t articulated yet: How will your team grow over the next two years? What’s your tolerance for learning new paradigms? Do you value explicit structure or flexible composition? These questions don’t have universally correct answers, but they’re more predictive of long-term success than benchmark comparisons or GitHub star counts.

Next time someone asks which framework to choose, ask them about their debugging strategies instead. The answer will tell you more about their architectural needs than any feature comparison chart ever could.